MaxDiff
Quickly understand the hierarchy of importance between different items with our integrated MaxDiff testing.
Quickly understand the hierarchy of importance between different items with our integrated MaxDiff testing.
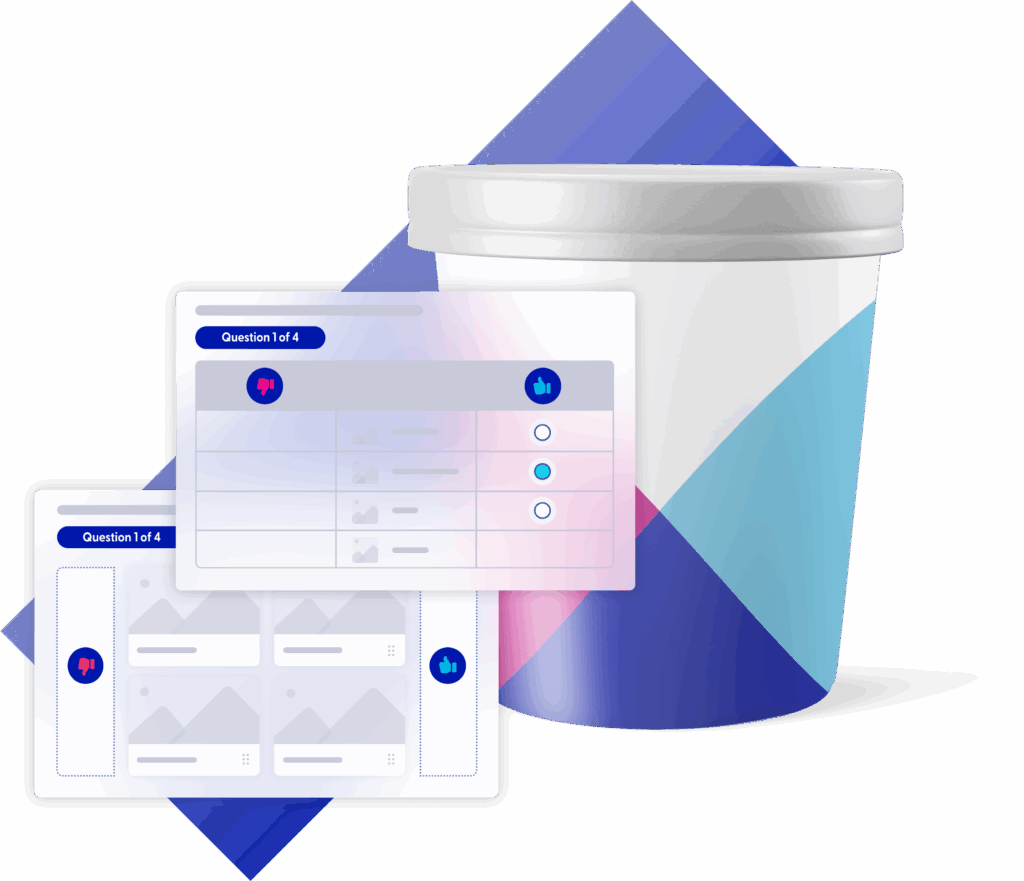
Maximum Difference Scaling, or MaxDiff, enables you to apply a traditional trade-off exercise to create a clear and robust ranking of different items (or a large number of items). It can be used in isolation or incrementally added into a broader custom survey, whether single or multi-market. It’s a versatile methodology used to understand the hierarchy of importance between different claims, flavors, features, varieties, names, taglines, fragrances, ideas, ingredients, messages, offers, or simply words and sentences.
Our automated setup is easy. In the MaxDiff pop-up screen, simply add:
The total number of items to be tested
How many items are to be shown per screen/respondent
How you want the MaxDiff to be displayed on screen (table or card view)
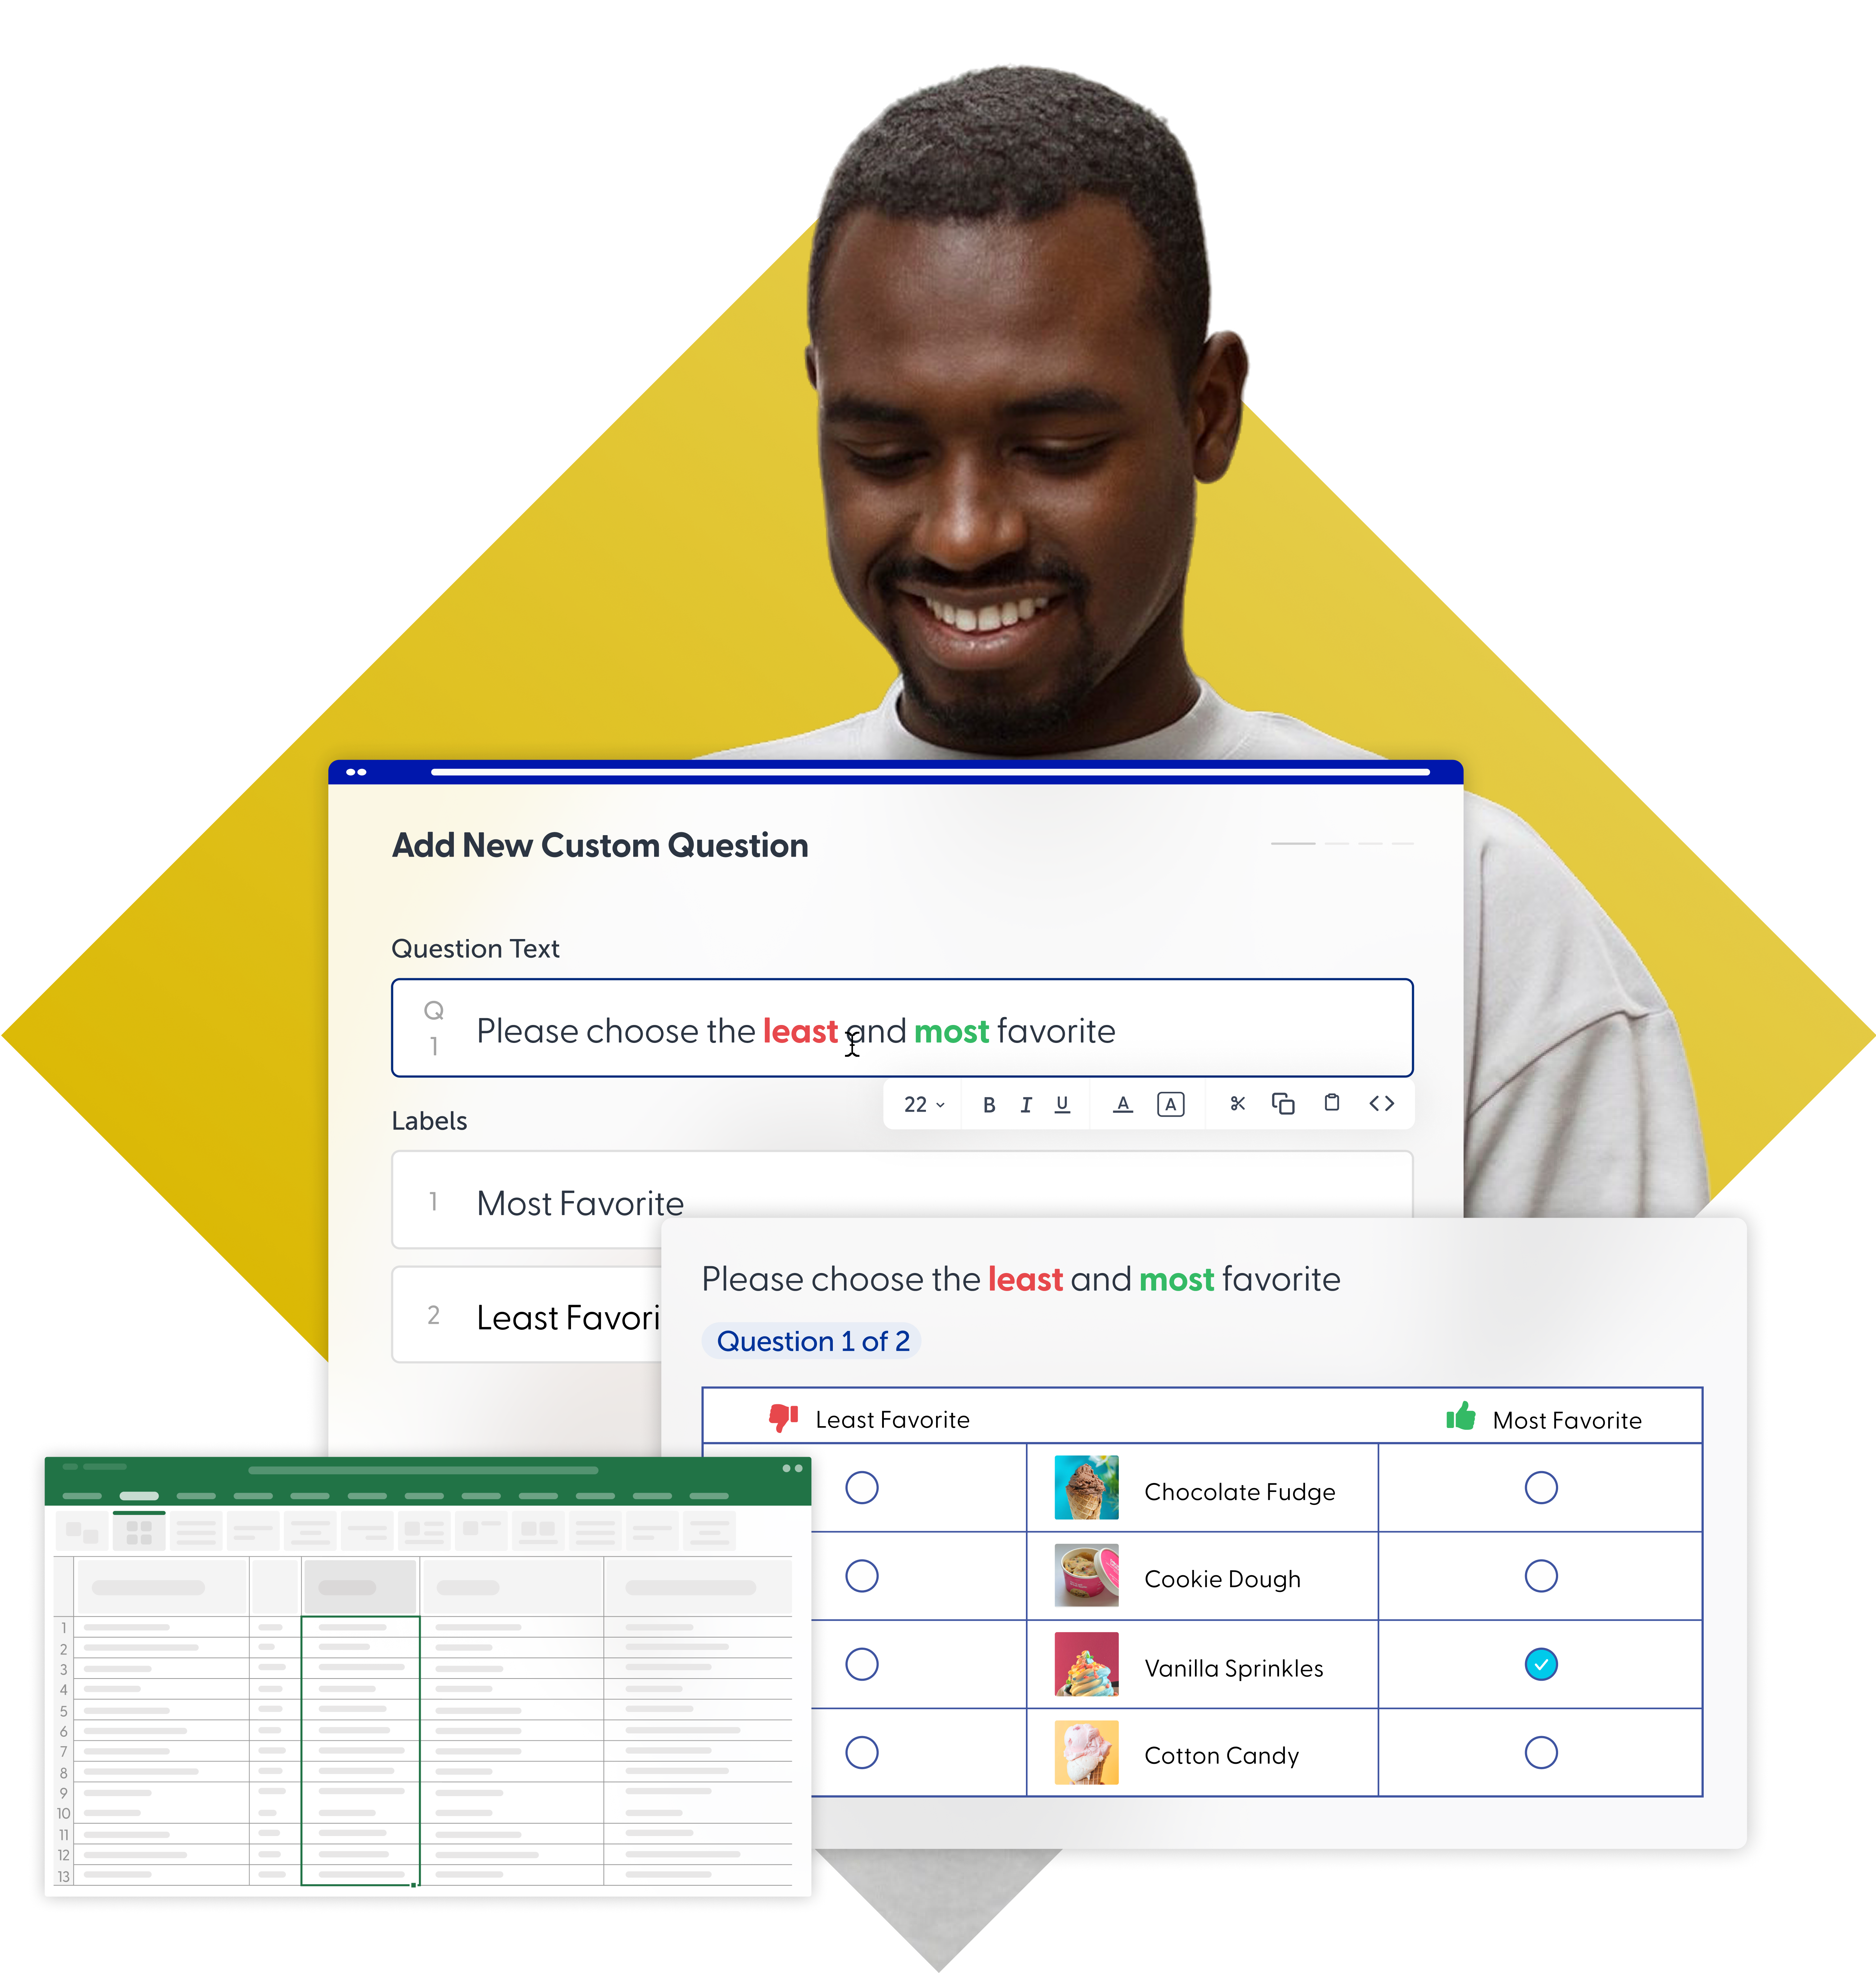
The pre-defined question option you want to use (or add your own)
The design will be created for you by our in-platform algorithm, and you can then customize your survey as needed. Post launch, the summarized data in the Analytics dashboard will clearly show you which one is best.

Best-in-class
Our MaxDiff methodology uses cutting edge technology, best-in-class research expertise, and is fully integrated with our global panel.

Although the design is automated for you, the use of MaxDiff remains flexible to meet your needs. You can add other survey questions before or after the MaxDiff module.


Test up to 40 items per survey, with feedback directly from your desired target audience. To enable high design quality, you need to test a minimum of 8 items.
Test images or text, branded or unbranded.
To ensure a quality design and output, the sample size is set at a default level according to the number of test items. If you are testing 8-20 items, it will be set at a minimum of 300 interviews; for 21-30 items at 400 interviews; and for 31-40 items at 500 interviews.
A behind-the-scenes algorithm calculates the design for each survey based on the number of items, the number of completed interviews/respondents, and the number of times each stimulus will be seen per question and per respondent. Each respondent will see all items an equal number of times. All of these factors combine to ensure a balanced design.
Any of the Toluna Start question types can be added before and/or after the MaxDiff module.
A MaxDiff survey will typically take about 5-10 minutes to complete per respondent. Your survey can be easily duplicated for re-use.
Choose your 'best/worst’ questions from our pre-defined list of 15 options (for select languages, these are already pre-translated for speed and ease of use) or choose a custom option with your own translation. Our default question option is “For the options below, choose your most preferred and least preferred”.
Add up to 2 MaxDiff scenarios in the same survey to view differences between audience segments.
MaxDiff is integrated with the Toluna panel, one of the world’s largest with 79+ million highly engaged consumers across 70+ markets.
You can target any audience. The minimum sample size for any survey will be set at 300 interviews for quality reasons.
Our range of demographic and category profiling questions provides efficient targeting without the need to re-ask these questions in your survey. Add custom targets/quotas to reach even more specific audiences.
When duplicating a survey, you have the option to duplicate the target and quotas along with it. You can also save your most used targets and quotas for easy application in any survey or choose a nationally representative quota.

Your results populate in real-time within Toluna Analytics as soon as your survey is launched.
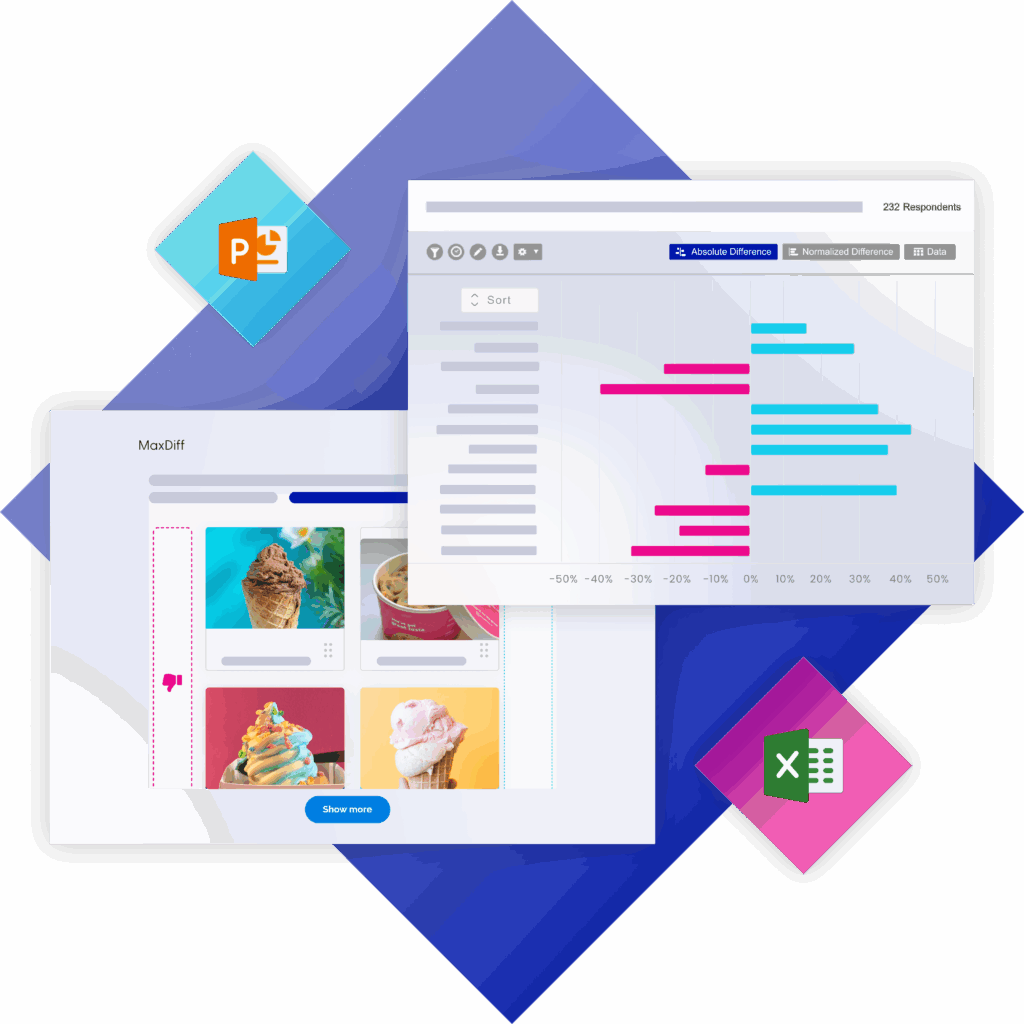
When your survey closes, our visual data summary will show a comparison of all items within your MaxDiff test so you can clearly see the best claim/varieties/name/tagline/etc. Filtering by culture is also available for multimarket surveys. Your results can be easily exported into Excel via the table in Toluna Analytics, or into PowerPoint if you want the bar chart visuals from Insights.
Data views include best %, worst %, absolute difference (best-worst), normalized score and rank. Our data science team can speedily supply additional analysis like TURF (Reach) and HB Advanced Utility Scores.