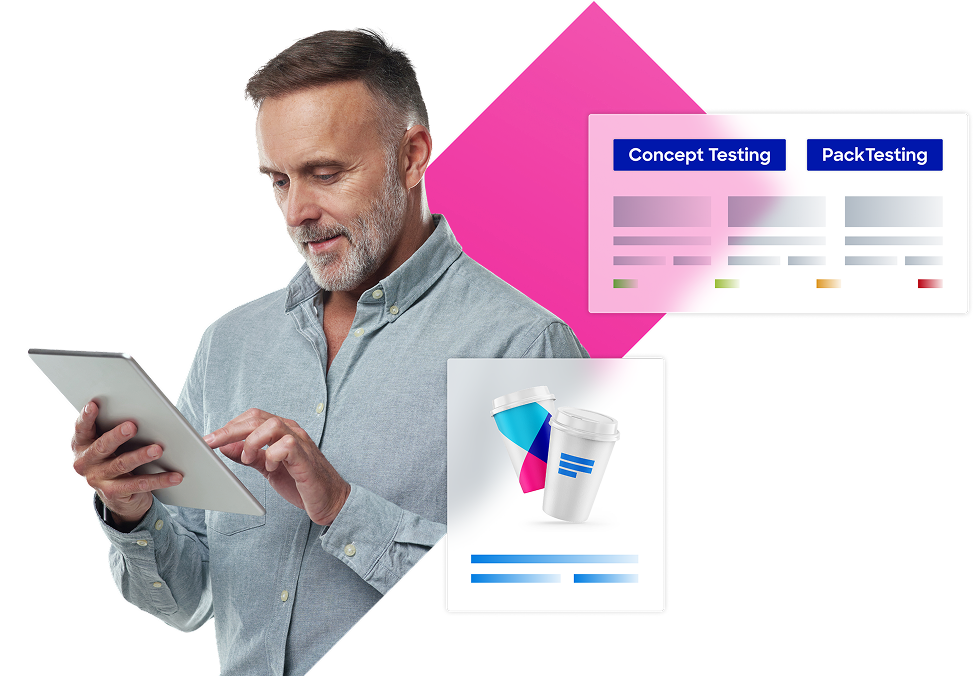
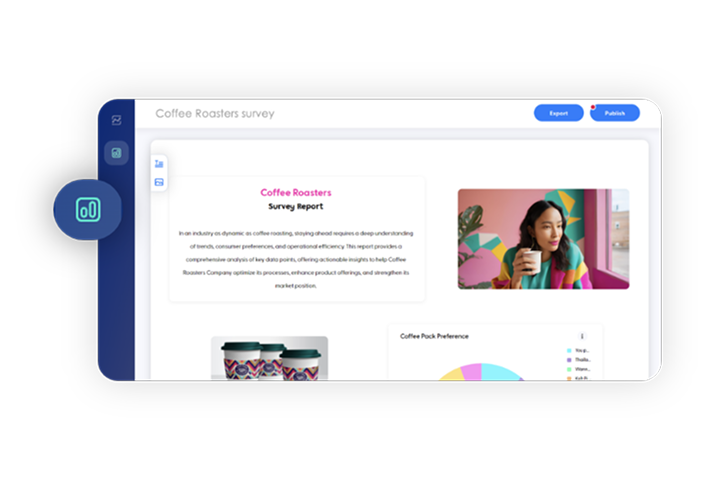
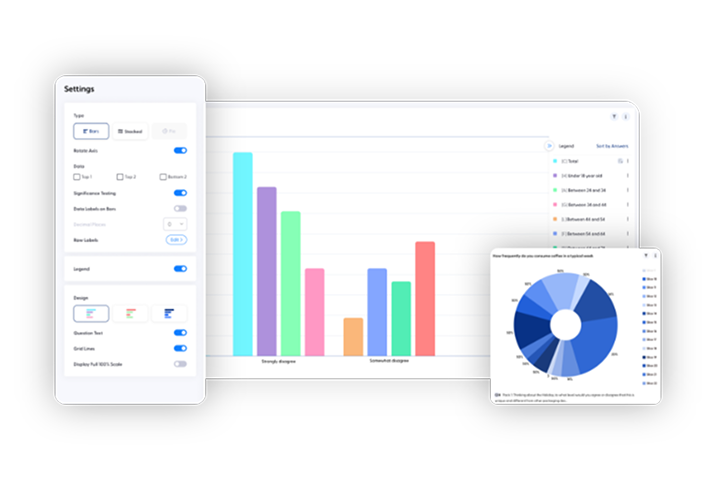
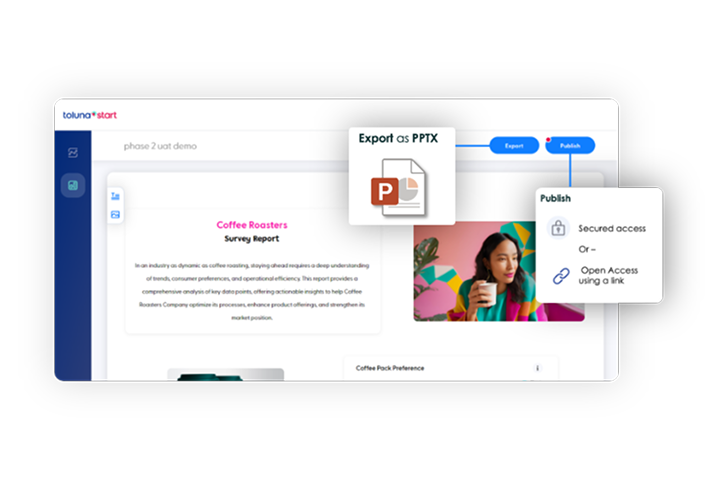
Measure performance against KPIs in minutes with dashboards designed to provide actionable insights.
Weight data, create sub-populations, filter and conduct all levels of significance testing.
Drag and drop PowerPoint slides, word cloud verbatims, build tables, and re-run banners as needed.
Data is available immediately, with the ability to access field reports and analyze data while surveys are still in-field.
Field reports, verbatim responses and key metrics all within a single interface.
Weight data, create sub-populations, filter and conduct all levels of significance testing.
Drag and drop PowerPoint creation, word cloud verbatims, and create tables/re-run banners as needed.
Measure key audience segment insights and performance against KPIs.