




Contact Us

Analytics and Insights that drive decisions

Get your data action-ready with real-time analytics, advanced reporting, and powerful visualization tools in Toluna Start. The Analytics and Insights tabs help teams uncover insights faster, communicate findings more effectively, and make confident decisions with ease. 

Toluna Analytics

Explore your data from every angle with flexible analytics, customizable reporting, and dashboards designed to accelerate decision-making. 

Analytics in action 

See how Toluna Start helps you explore, analyze, and share insights with confidence. From audience segmentation and KPI tracking for templated solutions, to customizable reporting and real-time dashboards, our analytics and reporting tools are designed to help you move from data to decisions faster. 

Share this
Compare performance to proven benchmarks 

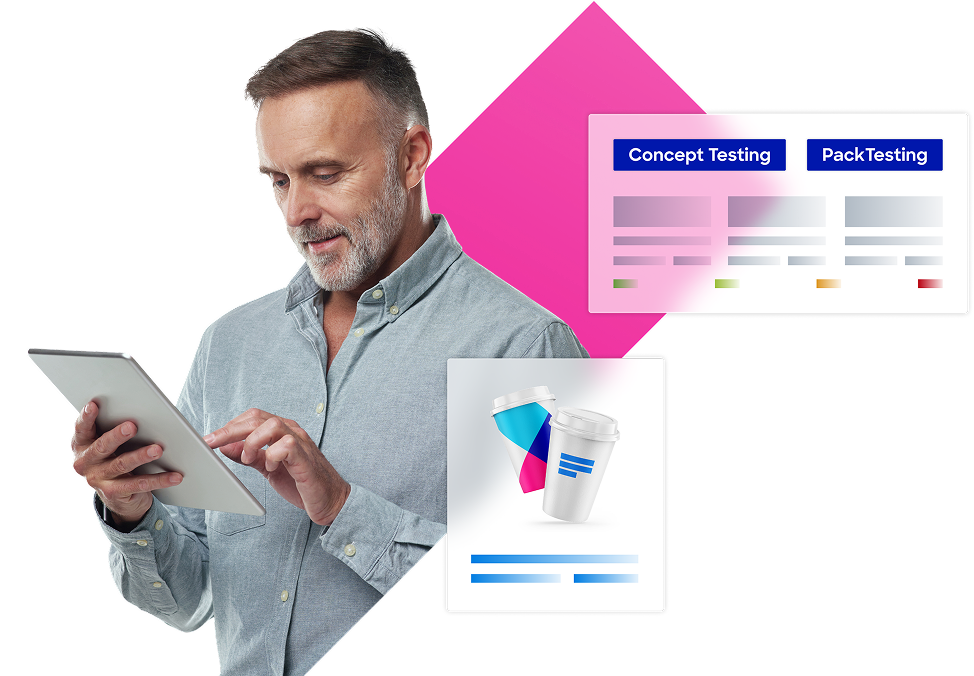
Access more than 225 norms across countries and categories for concept and pack testing. Compare performance against proven benchmarks to put results into context and make more informed product decisions. 

Toluna Insights

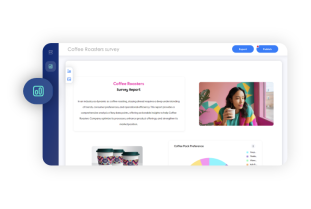
Transform analysis into compelling, shareable stories. Toluna Insights helps teams visualize findings, build presentation-ready reports, and communicate insights clearly to stakeholders. 

Bring your insights to life 

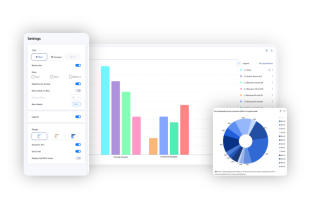
Communicate your findings clearly with styled charts, AI-powered SmartClouds, and intuitive, modern visualization tools. 

Tailor reports to your needs

Customize reports by repositioning charts, adding text and imagery, and tailoring outputs to tell the story behind your data. 

Share findings with confidence

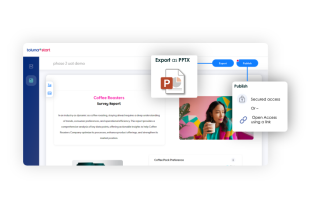
Publish reports as secure webpages or export presentation-ready PowerPoints to confidently share with stakeholders. 

Smarter, faster insights

Toluna Insights offers powerful analysis and reporting tools that let you compare results faster, uncover deeper understanding, and communicate findings more effectively. 

Side-by-side: compare with clarity and confidence

Compare concepts, packs, ads, or claims side-by-side in a single view. With built-in significance testing and flexible reporting, Side-by-side helps teams evaluate results more efficiently and make confident decisions faster. 

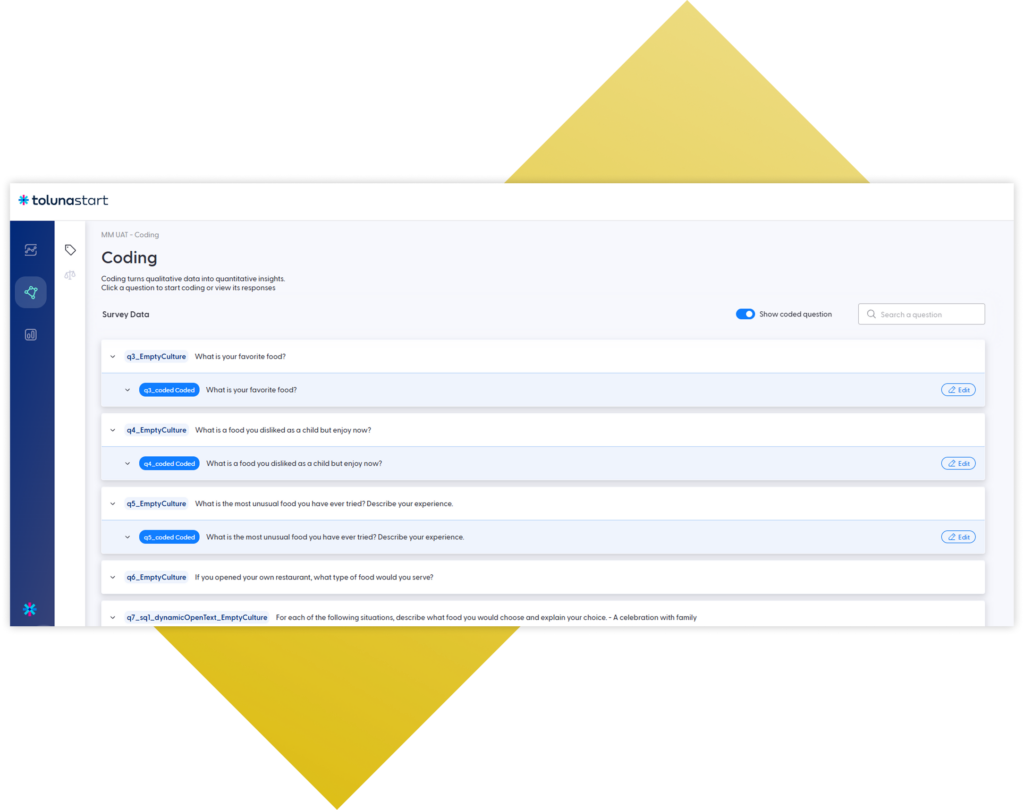
Coding: Turn open-ended feedback into structured insights 

Transform open-ended responses into structured, quantifiable data with your own custom code frames. Analyze feedback more efficiently, uncover trends at scale, and maintain consistency across studies, markets, and languages. 

Highlights: AI-powered summaries for smarter storytelling 

Highlights transforms open-ended responses into concise, editable summaries directly within SmartCloud. By helping teams quickly identify and communicate key themes, it saves time, improves clarity, and makes insight storytelling more effective. 

FAQs

Toluna Start provides advanced market research data analysis, visualization, and reporting capabilities to help you move from survey data to actionable insights. You can monitor results in real time, explore and compare findings, analyze open-ended feedback, use AI-powered tools to surface key insights and summaries, and create customized visualizations and reports to share with stakeholders. 

Toluna Start provides a range of tools for analyzing market research and survey data, including data weighting, filtering, sub-population analysis, significance testing, custom tables, and banner analysis. These capabilities help you move beyond topline results to explore differences between audiences, identify meaningful patterns, and investigate your findings in greater depth. 

Yes. Toluna Insights lets you compare multiple concepts, packs, ads, or claims in a single view. You can select the stimuli and metrics you want to compare and use built-in significance testing to identify meaningful differences and stronger-performing options more efficiently. 

Yes. Toluna Start offers AI-powered tools to help you turn unstructured, open ended feedback into actionable insights. Smartcloud identifies themes and sentiment, Highlights generates a concise summary of key findings, while Coding can turn open-ended responses into structured, quantifiable data using custom code frames. Researchers can review and refine AI-generated outputs, retaining control over the final analysis. 

Yes. For concept and pack testing, Toluna Start provides access to more than 225 norms across countries and categories. These benchmarks help put individual scores into context so you can understand performance relative to established norms rather than evaluating results in isolation. 

Toluna Start provides customizable data visualization and reporting tools to help turn research findings into clear, stakeholder-ready outputs. You can create and tailor reports using charts, text, and imagery, export results to PowerPoint, or publish reports as secure webpages for easy sharing. 

Ready to turn your insights into confident decisions? 

From advanced analytics to AI-powered insight generation, Toluna Start gives teams the tools they need to uncover, communicate, and act on insights faster.