Toluna Start offers several options to select from upon logging into the user interface. For an overview of all of the different features and what they do, please see our visual comprehensive ebook.
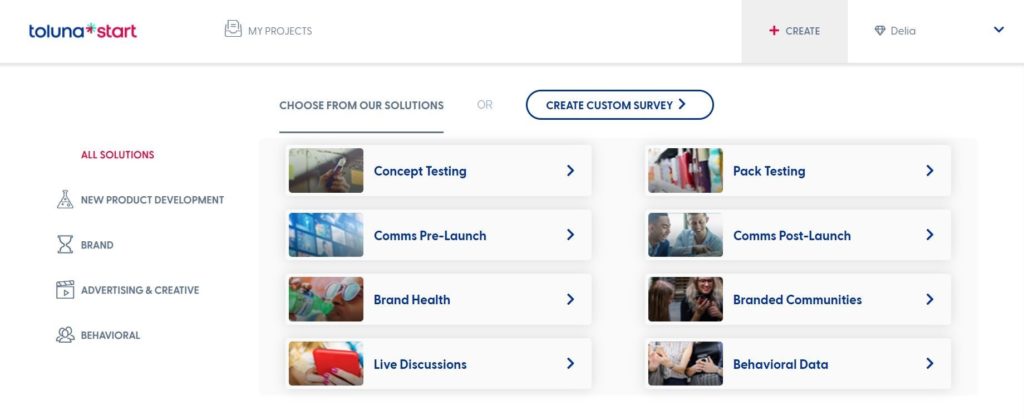
To view all available solutions, you can either scroll down to the tiles on your homepage or select the +CREATE menu on the top right of your screen.
The available solutions within Toluna Start range from custom surveys, to our automated solutions covering new product development, brand, and advertising/creative, and our qualitative engagement solutions.
Our automated solutions include a core set of predefined metrics and are developed using expert research methodology and a real-time infoboard output highlighting key metrics and KPIs. If you’re interested in a qualitative approach, Live Discussions can be used to run qualitative engagements and even used as a wrap-around approach to complement other platform solutions, while Branded Communities allows you to create your own panel of members.
In this post, we’ll focus on Creating a Concept Test using our automated solution. For more information on our automated solutions, click here.
Our automated concept testing helps you to identify winning concepts that are distinctive, credible, and drive purchase intent. Using our templated approach, setup is easy and takes only minutes, with real-time insights populating into an interactive infoboard and analytics dashboard as soon as your concept test is launched. Our solutions are also fully flexible, allowing for customization in the build of the survey. Changes to the existing survey structure will reflect in the infoboard and anything new in your Analytics dashboard.
The Create a Concept Test option will provide you with a wizard to get started, with several predefined question types, elements, and exercises to choose from.
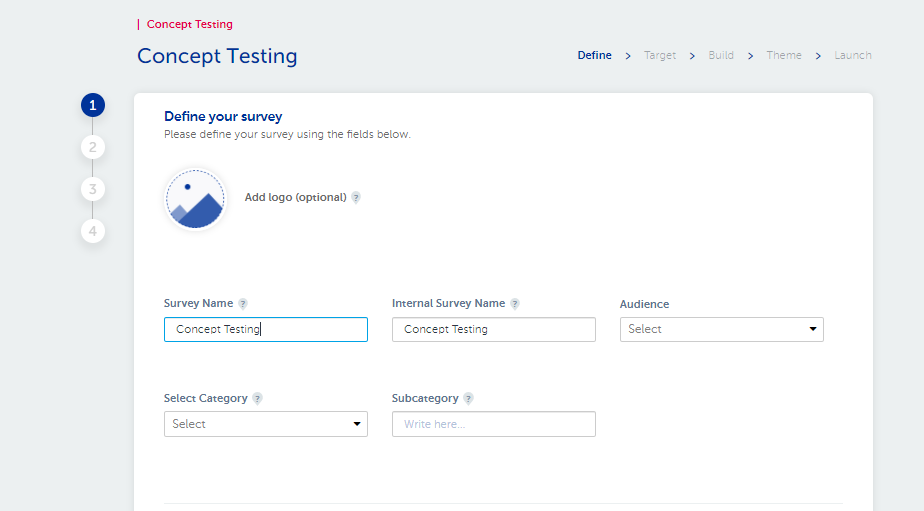
After selecting Concept Testing, you will be taken to the very first page of the survey setup wizard called theDefine page.
Within the Define screen, you will be asked to define the parameters of your project.
Survey Name: This will be the name of your survey visible to respondents. We recommend keeping this generic to avoid any potential response or recruitment bias.
Internal Survey Name: This name will not be visible to respondents. This name can be used for you and your team members to identify similar surveys with ease.
Audience: This will define both the language and region of the audience you would like to reach. It will also drive the language of respondent instructions, error messages, and targeting variables available for the survey.
Category: This variable is used to categorize surveys for benchmarking/norms so we can put your results into context.
Subcategory: This helps to further classify surveys within specific categories to enrich the information we have available for norms. The wording added here also pipes through to specific questions in the survey to make the context relevant for the respondent.
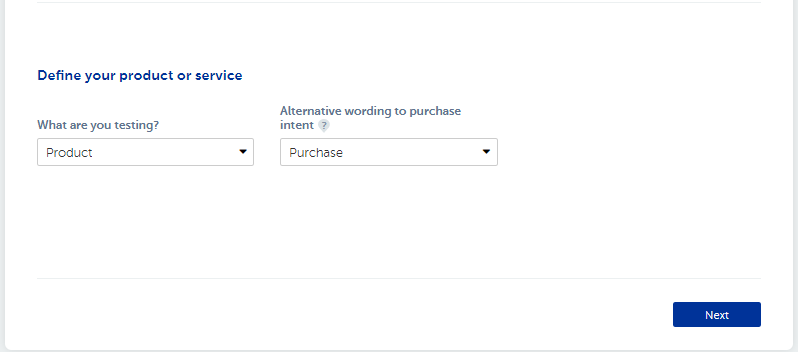
Next, you will need to define the product or service you are looking to test.
The first drop-down asks “What are you testing” with the choice of Product, Service, or Range. The option you select here will be piped into subsequent questions and answers in the survey when referring to the concepts being tested.
Secondly, you have the option to customize the wording for the purchase intent question – an important question and metric that can be selected as part of the survey build. This will help to ensure the respondent sees wording that makes sense based on the concept/category that’s being tested.
Options within the “Alternative wording to purchase intent” drop-down include Purchase, Consume, Use, Choose, Take Out, Try, Play With, Watch, Subscribe to, Pay to Subscribe to, Download, and Visit.
You may be asking, how does the wizard link with the questions that are automatically populated for the survey, and which questions does it link to?
Elements of the wizard are piped through in specific places in different questions. Any questions/metrics not highlighted here aren’t impacted by the wizard automation.
Introduction – We’re now going to show you a [product/service] concept and would like you to answer specific questions about it.
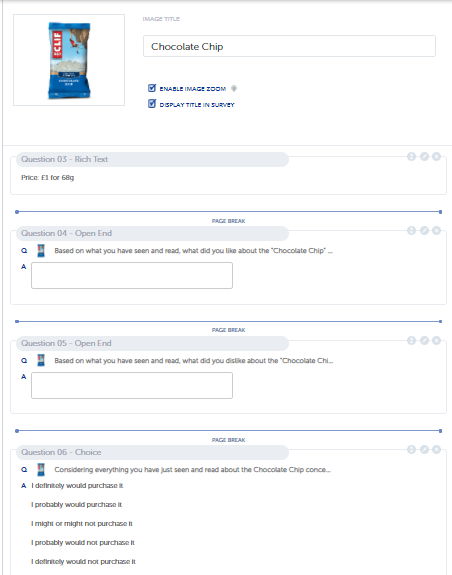
Like OE – Based on what you have seen and read, what did you like about the [concept name] concept?
Dislike OE – Based on what you have seen and read, what did you dislike about the [concept name] concept?
Likeability/Appeal – Using the scale below, please indicate to what level you like or dislike [concept name]
Concept name & PI text/alternative text e.g purchase, use, subscribe, etc.
Purchase Intent unpriced – Considering everything you have just seen and read about the [concept name] concept, how interested would you be in [purchasing/using /subscribing] in the future if it were available at an attractive price for you?”
CPG only Frequency – How often do you think you would [purchase/use/subscribe, etc.] [concept name] if it was available where you shop?
Purchase intent priced – Considering everything you have just seen and read about the [concept name] concept, how interested would you be in [purchasing/use/subscribing, etc.] in the future if it were available at a price of [price with any unit/currency info attached]
CPG only – the number of units per purchase – Thinking about each time you [purchasing/use/subscribing, etc.] [subcategory], about how many would you usually buy?
Value for money – Considering the price of [price and unit/currency info], which statement best describes how you feel about the value of the [concept name] concept.
Distinctiveness – Thinking about [subcategory] and based on the [concept name] concept, to what level do you agree or disagree that the [product/service] is unique and different from other [products/services] within this category?
Brand fit – Please indicate how well you think it fits with [brand name]
Brand Appeal – Now, this [product/service] is from [brand name]. How much does this add or detract from the [subcategory] appeal?
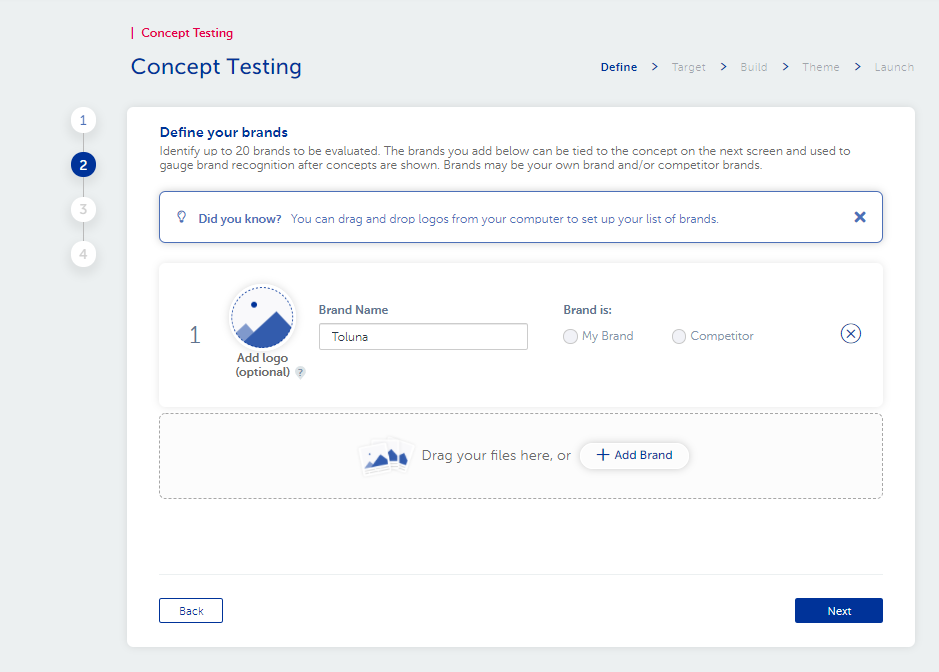
Now that you’ve defined your project details and product or service, you will be taken to the next page in the wizard where you can define your brands.
If you are running a branded concept test, you can define up to 20 brands which can then be easily linked to the concepts that will be tested within the survey. These brands can be a combination of your brands and competitor brands. By adding brands within your survey and tying them to the relevant concept, you can make evaluating concepts within a particular brand easier. If your concepts are unbranded, you can simply skip this page and move on to the next.
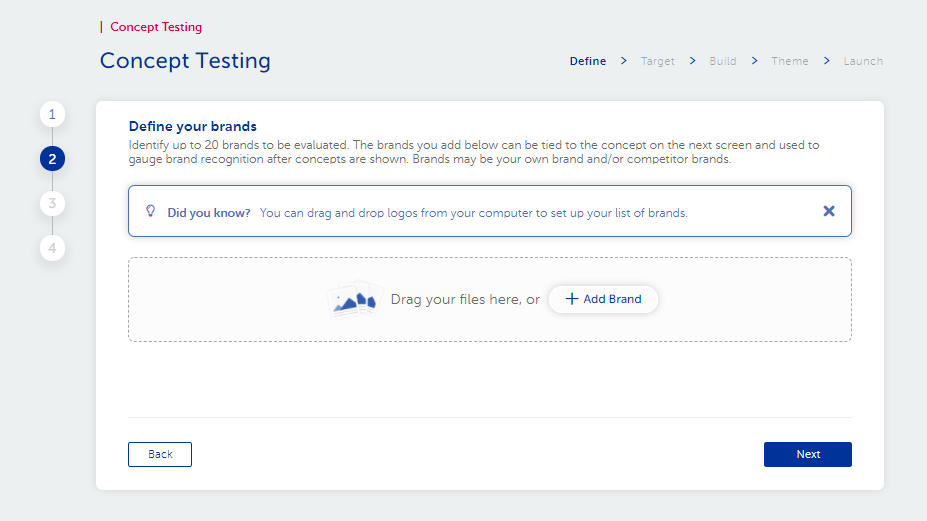
A logo can be dragged and dropped to begin defining a particular brand or the Add Brand option can be selected from within the center of the screen. A brand can also be added without a logo as well, by simply defining the name of the brand and whether it belongs to you or a competitor.
If for the purpose of your research you do not want to define your brand or brands of the competition, you can also click next to skip this page and move on to the next page in the wizard.
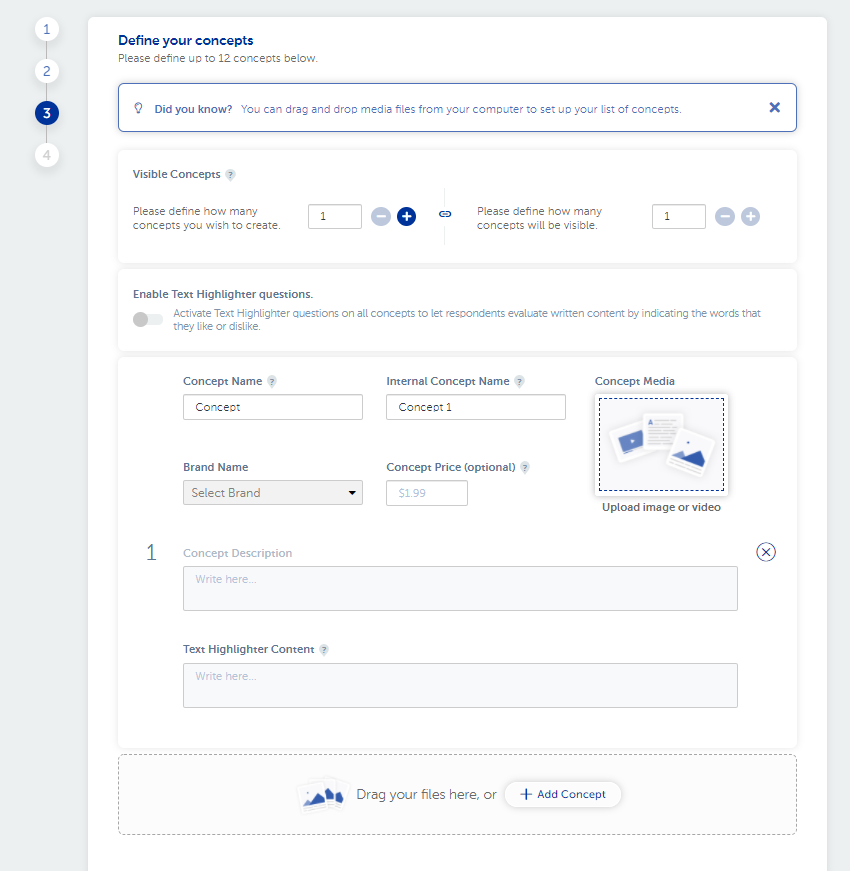
The next page of the wizard is where you will add the concepts you wish to test.
You can add up to 12 concepts per survey.
Next, you have the option to define the number of visible concepts i.e. the number of concepts that will be visible to each respondent in the survey. Although monadic (showing only one concept per respondent) is our recommended best practice; sequential monadic is possible.
Next, you can select whether or not to Activate Text Highlighter questions on all concepts. This question type allows respondents to evaluate written content by indicating the words that they like or dislike. Once this is activated the user just copies/pastes the text into the text highlighter content section.
Concepts can be set up using images, text, video, or a combination. All stimuli can be added using the drag and drop function, saving time from the traditional searching and uploading of collateral. Each concept can be Branded or unbranded; priced or unpriced. Priced information can include different currencies and unit options depending on the concept being presented, e.g. $1.99 for 1 liter or $1.49 for 750 ml. We leave room for lots of flexibility and customization throughout the entire build of our concept test solution.
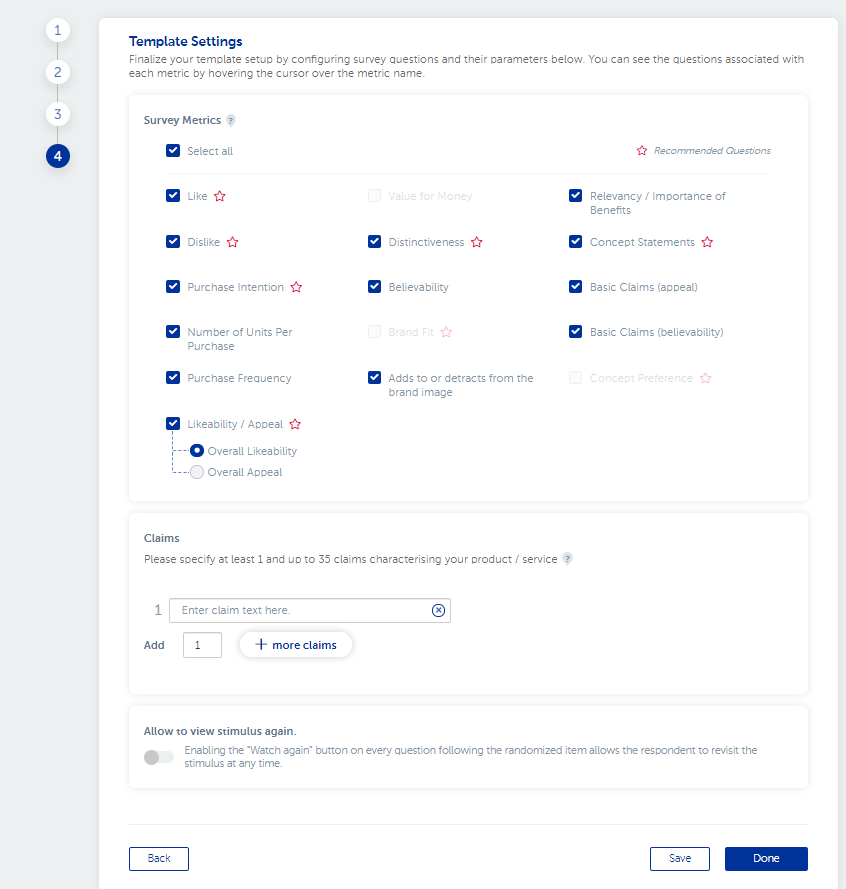
Once you’ve defined your concepts, click next to be taken to the Template Settings screen where you can decide on the metrics you’d like to include in your survey. To see the full question text, simply hover over the metric and you can view this detail in the associated pop-up. Those with a * next to them are the best practice core questions as advised by our research experts. To note, the preference metric will only show if there is more than one concept being tested, brand will only appear if concepts are branded and value for money will only appear if they are priced.
Sometimes users like to test a set of product/service claims during a concept test. A claim is usually a benefit or feature or a promise statement that your product is conveying to the consumer. If you select either of the metrics associated with Claims, you will need to write in the claims text you’d like respondents to see in the survey. Claims only need to be entered once and can be used in both related questions (appeal and believability).
Lastly, you have the option to enable the Watch again feature for respondents at each question. By selecting this feature, you enable respondents to review the stimulus again for any key metric question in the survey.
Once you’ve completed the wizard, you have the option to save or select Done.
We recommend that you select Save first and carefully check that the details you’ve entered and uploaded are correct.
After this, you can click Done. This automatically populates all of your information into a survey questionnaire.
NOTE: Once you’ve selected Done, you cannot go back and edit the wizard. The target screen, questionnaire, stimulus and pipe ins that are used to create your survey all feed in from the wizard. This is why the checking process is so important.
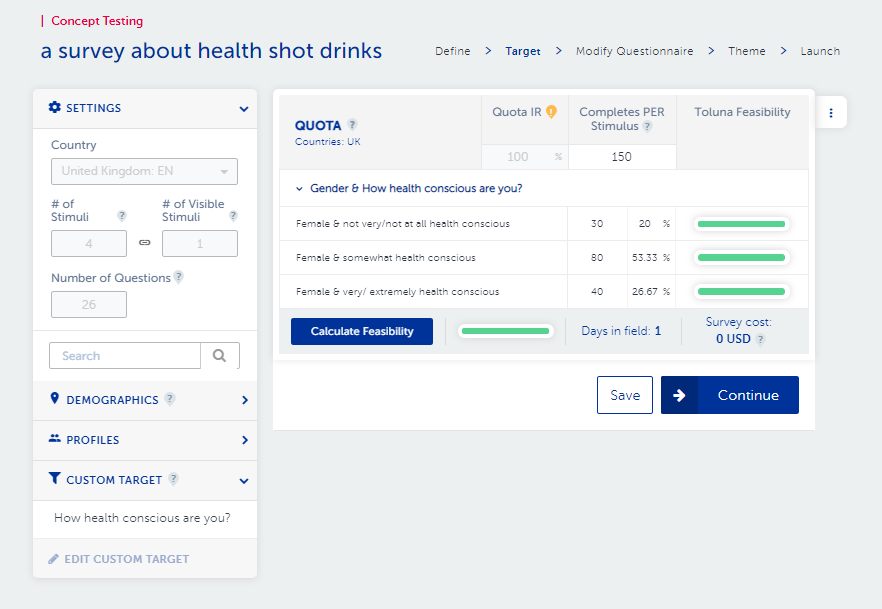
On the target screen, you should see the country and audience language that you selected on the Define screen. You will also see the number of stimuli and number of visible stimuli presented on this screen, based on what you entered in the concept section of the setup wizard.
Number of Questions in your survey is populated based on what you’ve selected in the wizard. This field will also automatically update should you choose to add any additional questions to the build section.
The targeting options available on this screen will adjust based on the language and region selected. Select from a series of targeting variables available for our members. We offer standard demographics such as age, gender, and region as well as more in-depth demographics and profiles if you are looking for a more specific audience. From media habits to household details, profiles allow you to more precisely and efficiently reach your target audience. You can add them by dragging and dropping them into the targeting area.
Can’t find what you are looking for? Use our Custom Target option to pre-profile respondents before they even enter your survey.
NOTE: If you use custom targets, it is critical that you also enter an incidence estimation (IR) to reflect the approximate number of qualified respondents based on the screener being set up.
Variables can be added to the target by simply dragging and dropping the options needed from the left-hand pane beneath the quota section. Multiple variables can be added in layers, or quotas can be interlocked. We recommend interlocking/nesting quotas to get the best results.
Enter your estimated target incidence and the number of completed interviews you’d like to achieve. Ensure the targets have been set for each quota. Use the magic wand function to evenly distribute completes across your quota cells.
Once your target has been set, you can calculate your feasibility in real-time by simply selecting Calculate Feasibility along the bottom of the screen. if everything is green then it’s good to proceed but if anything is orange/red then the target options will need adjusting to ensure survey completion.
When using our concept testing solution, you are taking advantage of our Random Assignment and Quota Balancing feature. We uniquely apply quota balancing/cell matching based on your demographic, profiling, and or custom target quotas ensuring high-quality results you can rely on. For more information on Random Assignment and Quota Balancing, please click here.
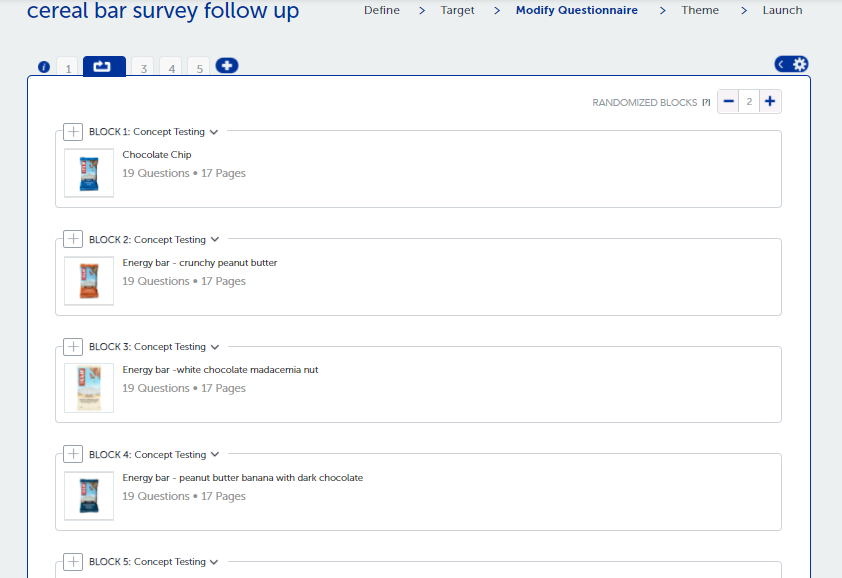
Once your target is all set, you will be taken to the “modify questionnaire/build” section of the survey. This is where the questionnaire is automatically populated based on the wizard information and metrics selected. This includes additional technical quality questions which check respondents will be able to see/hear the stimulus correctly with anyone not able to be screened out. We also automatically enable image zoom to ensure respondents can clearly see the concept detail.
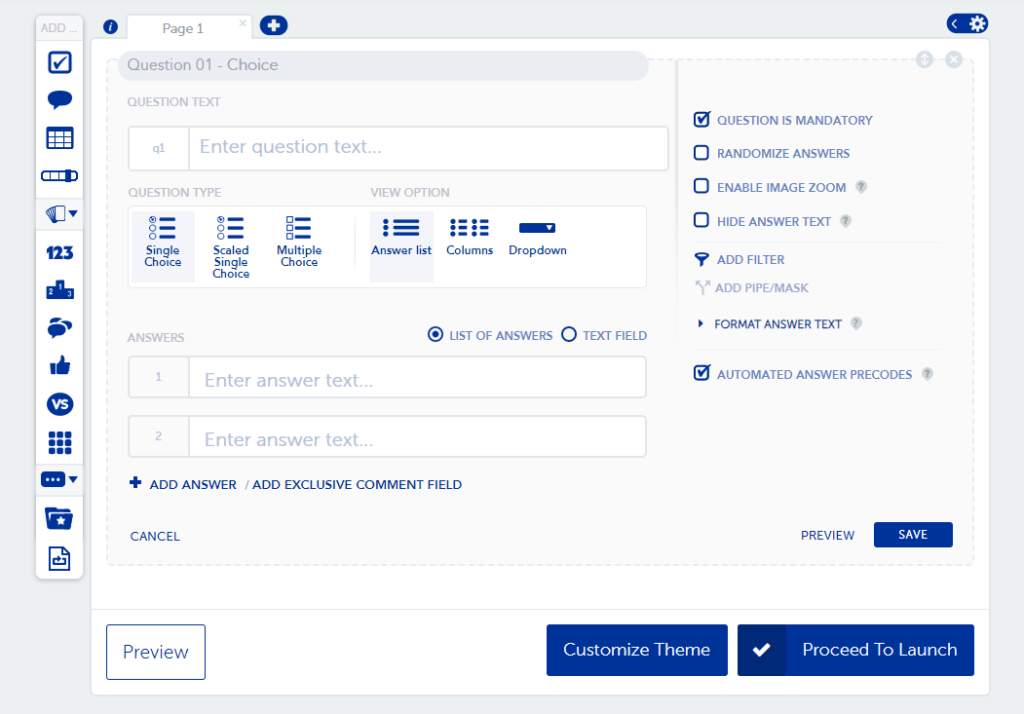
The questionnaire can either be used and launched to respondents as is, or if customization is needed, there is full flexibility to adjust as needed.
As a minimum, we recommend that you preview your survey and check it is working as expected and if not, to manually adjust as needed. We also suggest including and tailoring the survey intro page for respondent clarity/engagement.
Each concept is captured within a random assignment block. The questions for each block are in the same specific order as recommended by our research and methodology experts but you can change this if needed. You can also remove any questions or alter the question phrasing. These customizations need to be applied for each block.
You can also add any additional screening or custom questions. Once you are satisfied with the build of your survey, the next step is to Proceed to Launch.
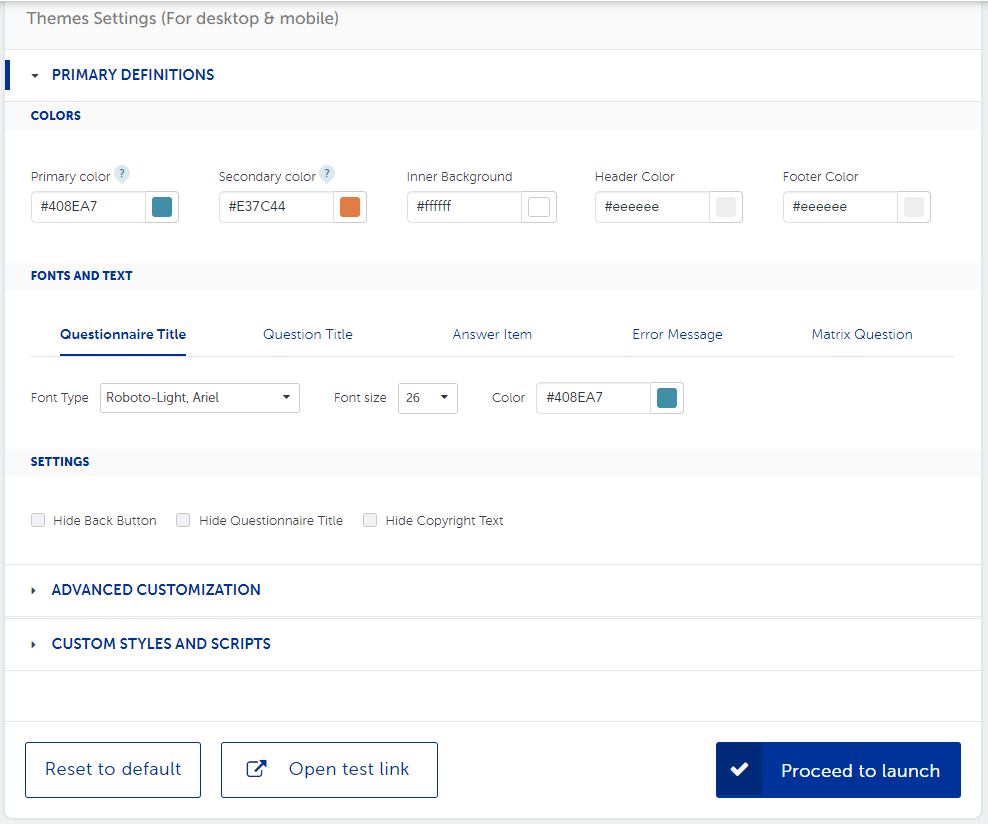
Your survey theme can also be customized based on the look and feel you’d like to achieve for your survey. Adjust font styles and colors to align closer with your brand. Your survey comes with a built-in, optimized theme ready to go, so no customization is necessary for a positive respondent experience.
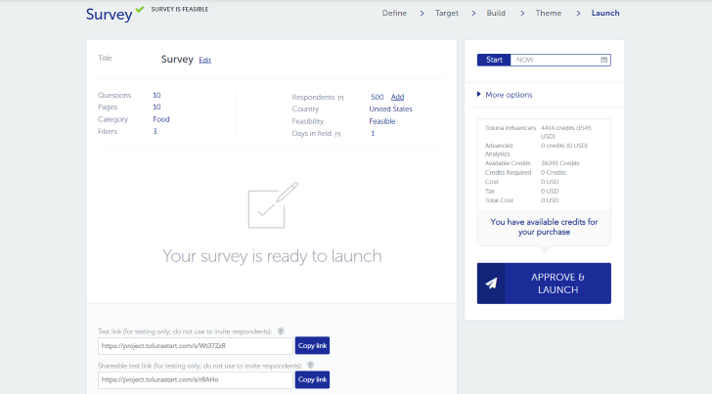
Before launching your survey, there are a few steps that are important to take in order to ensure the survey experience is optimal for respondents.
Step 1: Review your survey details. Make sure that the information displayed in terms of the number of survey questions, incidence estimation, number of completes, and country all align with your needs and expectations.
Step 2: Test your survey using the test links at the bottom of the page. The first test link features a jump to option which will allow you to jump from question to question (this is not recommended for surveys using filters and logic). The second link is the standard test link which requires testing of the full survey.
Step 3: Once you’ve reviewed all aspects of the project, you are ready to launch!
Note: If you’d like to exclude respondents from a previous survey, this feature is available under more options on the right-hand side of the launch screen.
Next, simply review the cost of the project, Approve and Launch. If you do not have enough credits to launch your project, you can purchase additional credits at this point as well.
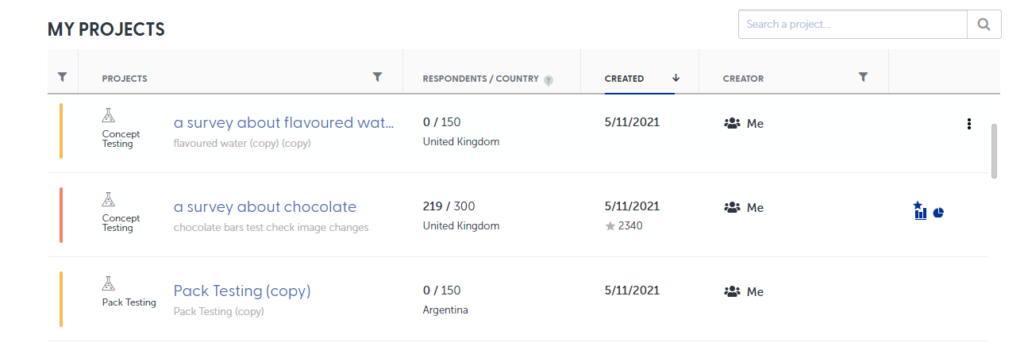
Once your survey is live and in the field, you will have the opportunity to monitor it in real-time using our Analytics link – the standard output on every Toluna project. Once the survey has collected the first respondent, your report will become available on your My Projects page.
Note: The 4 most recent projects will always be shown in recent projects on the TS home page with the analytics there for easy access.
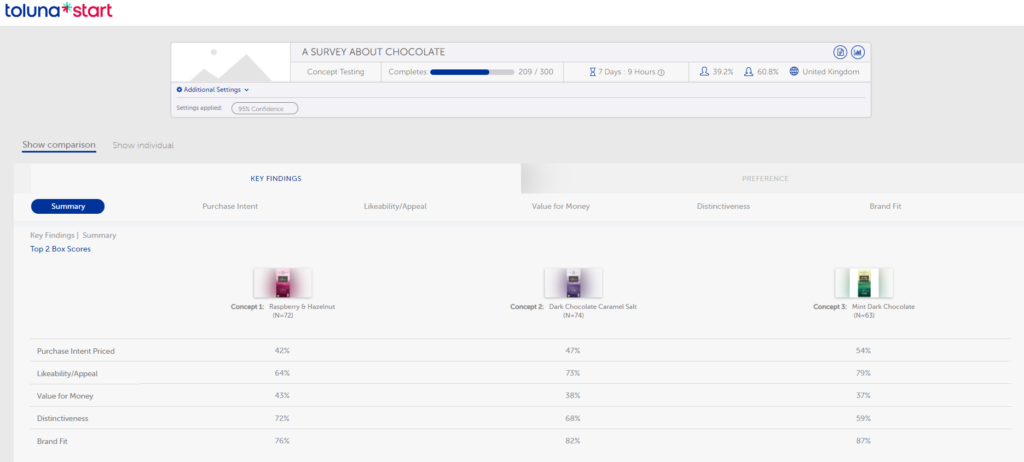
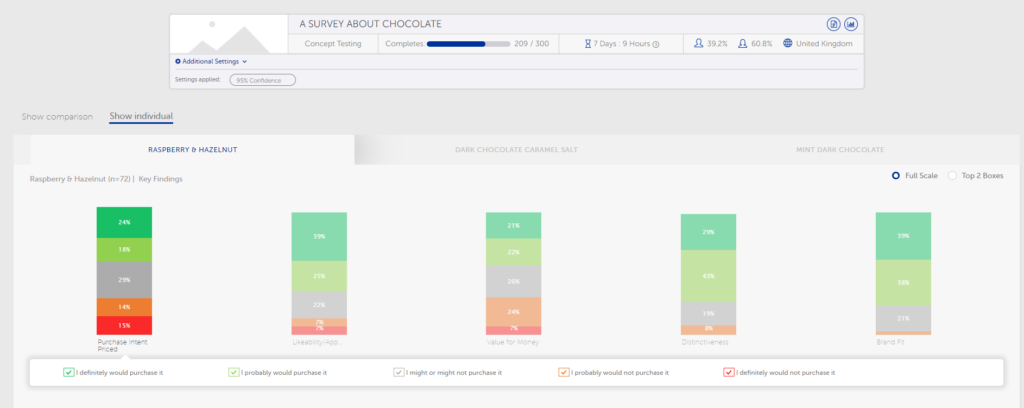
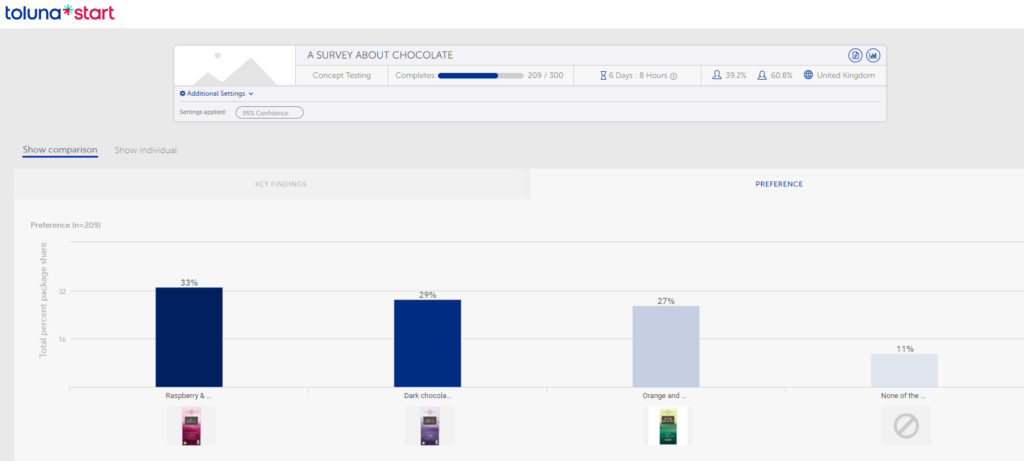
Additionally, a key deliverable for all of our automated solutions is a high-value, real-time infoboard. This deliverable is designed to give you a clear, visual view of your results and to help you expedite your decision-making.
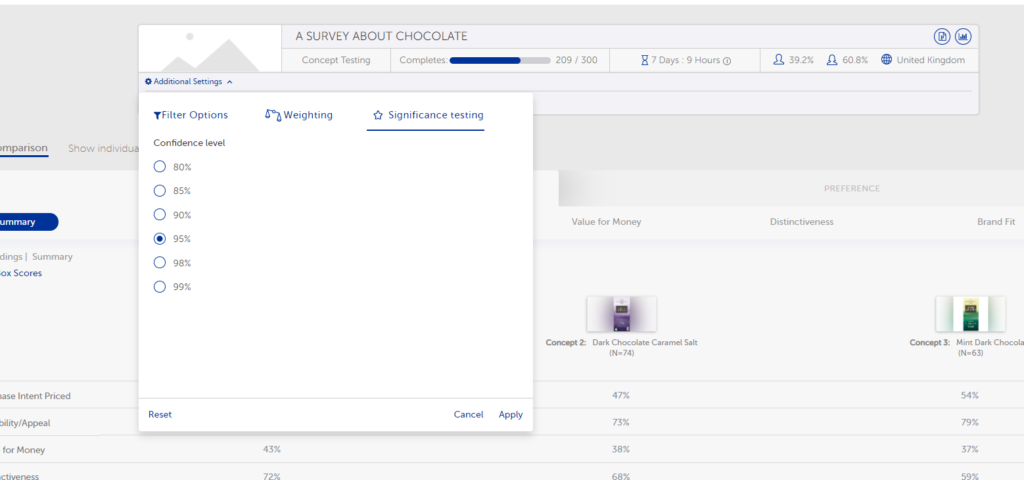
Within the infoboard, clearly see your best performers depicted. Our interactive infoboard visualizes the insights through a side-by-side comparison of all concepts across KPIs, with significance testing to clearly highlight the best performers and outright winners.
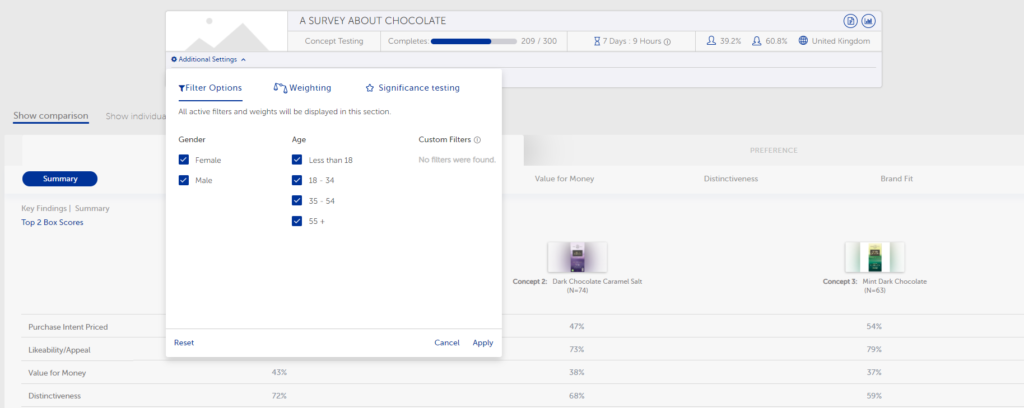
Concepts can be significance tested at different levels from 80%-99%. Create subpopulations in Analytics to filter results in your infoboard by different demographics (age, gender, and other key items are automatically available) or by custom options.
All outputs are easily exportable into an editable PowerPoint for further use or sharing with your stakeholders.
Additionally, we can help you understand ‘what good looks like’ by comparing your results to our extensive 10k+ norms database.
From the infoboard there is a link to the Analytics report. All of your survey results feed into here in real-time including your additional custom questions. Your results can also be viewed by different subpopulation groups.
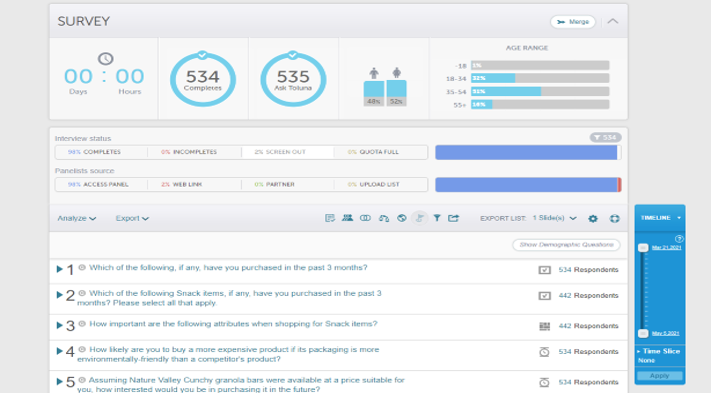
Leverage the host of analytical functions, export options, and sharing capabilities all from within your report.
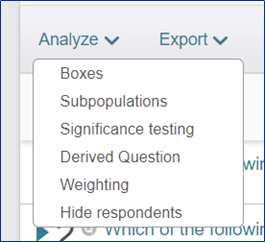
Analyze your survey using functions such as top/bottom boxes, subpopulations, significance testing, derived questions, and weighting. Additionally, if you’d like to hide the answers of a group of respondents, you have the ability to upload a “hide respondent” file which will be excluded from your survey results.
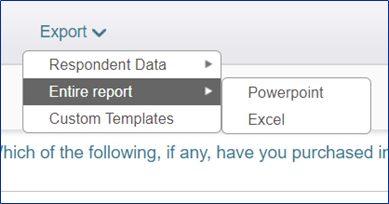
Export your entire report and/or specific questions into PowerPoint or Excel for ease of sharing and presenting your results. Upload custom PowerPoint templates to create a branded presentation.
Additionally, if you are looking for raw data, this is available for export in Excel and SPSS as well.
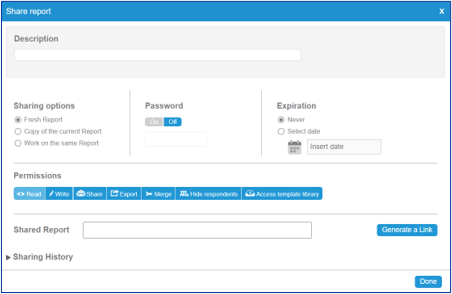
Share your survey with clients or stakeholders. Create a link to a fresh report, a copy of the report you’ve created, or allow your team to collaborate within your report. You can enable a password protection feature or link expiry, depending on who you plan to share with.
Add or remove permissions to export, share, merge or hide within your shared report.
Questions on building out a concept test? Contact us.
Don’t have time to become a survey pro? Let our team of experts assist you.
For more information on working within the Toluna Start platform, visit our resource center at here.


 Back to Blog

